
Solo ads performance benchmarks are the specific metrics that define whether your email traffic buys are profitable or burning your budget. The core numbers you need to track are cost per click (CPC), opt-in rate, and cost per subscriber (CPS). In 2026, premium Tier-1 traffic costs $0.70–$1.00 per click with opt-in rates of 35–45%, while mixed traffic runs $0.30–$0.50 per click with opt-in rates of 15–25%. Understanding these solo ads performance benchmarks explained here gives you a clear framework for evaluating vendors like Ihsan Solo Ads and platforms like soloadsworld.com before you spend a dollar.
What are the essential solo ads performance metrics to track?
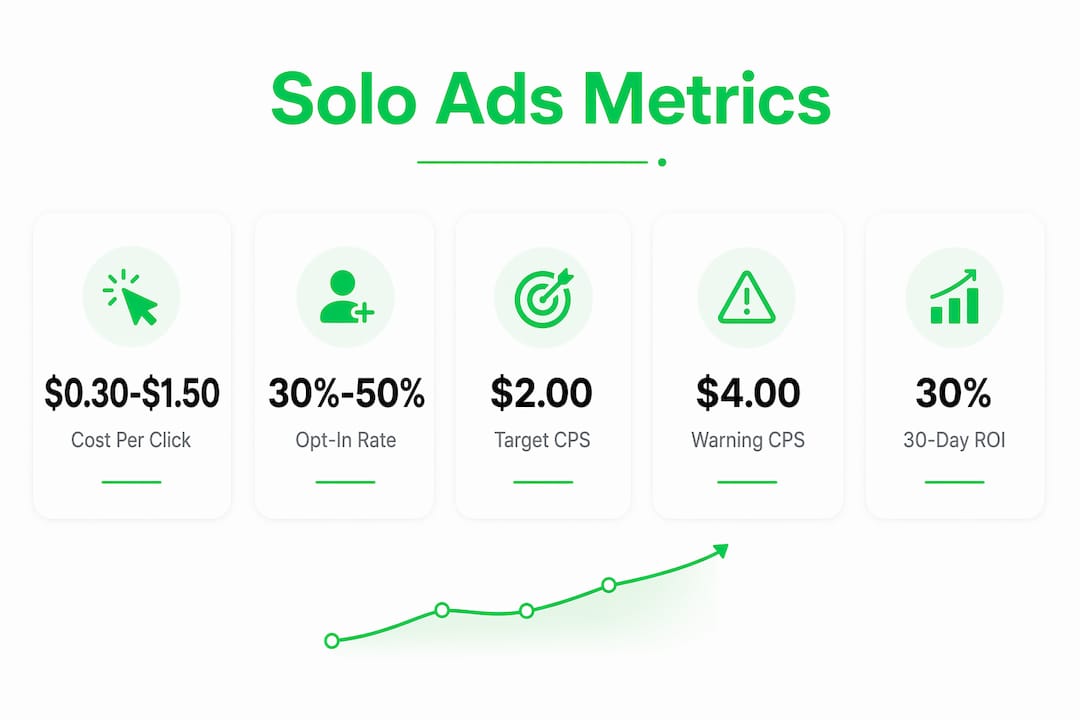
Solo ads metrics fall into four categories: traffic cost, list-building efficiency, subscriber value, and return on investment. Each one tells a different part of the story. Tracking all four together gives you a complete picture of campaign health.
Cost per click (CPC)
CPC is the price you pay for each visitor sent to your squeeze page. Solo ad CPC ranges in 2026 span $0.30–$1.50 depending on traffic quality and vendor reputation. A lower CPC does not automatically mean a better deal. What matters is what happens after the click.

Opt-in rate
Opt-in rate measures the percentage of clicks that convert into email subscribers. Healthy opt-in benchmarks for solo ads campaigns in 2026 sit at 30–50%. Rates below 25% signal a funnel problem, a traffic quality issue, or both. This is the first metric to fix before scaling any campaign.
Cost per subscriber (CPS)
CPS is the real cost of building your list. You calculate it by dividing total ad spend by the number of new subscribers. Marketers should target a CPS under $2.00 for profitable campaigns. A CPS above $4.00 requires an immediate review of your funnel or traffic source.
Earnings per click (EPC) and ROI
EPC measures how much revenue each click generates across your entire funnel, including front-end offers and back-end email sequences. ROI compares total revenue against total spend over a defined window, typically 30 days. These two metrics tell you whether your list is actually worth building.
Pro Tip: Track EPC and ROI over 30 days, not just the first 48 hours. Most solo ad profit comes from follow-up sequences, not the initial offer.
How does traffic quality affect solo ads benchmarks?
Traffic quality is the single biggest variable in performance metrics for solo ads. Not all clicks are equal, and the difference between Tier-1 and mixed traffic shows up directly in your numbers.
Tier-1 traffic refers to clicks from subscribers in the United States, United Kingdom, Canada, Australia, and New Zealand. These audiences convert at higher rates and produce more engaged email subscribers. Mixed or Tier-2/3 traffic includes clicks from lower-income markets where purchasing power and email engagement are significantly lower.
The table below shows typical benchmark differences by traffic quality tier.
| Traffic Tier | Typical CPC | Opt-In Rate | Email Open Rate | CPS Estimate |
|---|---|---|---|---|
| Premium Tier-1 (90%+) | $0.70–$1.00 | 35–45% | 20–30% | $1.60–$2.50 |
| Mixed Tier-1/2 | $0.30–$0.50 | 15–25% | 8–15% | $1.80–$3.50 |
| Tier-2/3 Heavy | Under $0.30 | 8–15% | 2–8% | $2.00–$4.00+ |
The math here is counterintuitive. Cheaper clicks with poor opt-in rates actually cost more per subscriber than premium clicks with high opt-in rates. For example, $0.30 clicks at 12% opt-in produce subscribers at roughly $2.50 each. Meanwhile, $0.85 clicks at 42% opt-in produce subscribers at roughly $2.02 each. The "cheap" traffic ends up costing more.
Traffic quality also affects email open rates, which are a critical downstream metric. High opt-in rates paired with near-zero email opens indicate poor list quality. You built a list, but nobody on it is engaged. That kills your long-term ROI regardless of how good your front-end numbers look.
Pro Tip: Ask vendors for their Tier-1 traffic percentage before ordering. Any vendor offering 90%+ Tier-1 traffic at $0.30 per click deserves serious scrutiny.
How do you calculate ROI from solo ads campaigns correctly?
Most affiliate marketers calculate solo ads ROI wrong. They look at front-end sales from the first 24–48 hours and declare the campaign a loss. That approach misses the majority of the revenue.
The correct method tracks revenue over 30 days and accounts for your full email sequence. Here is the step-by-step process:
- Record total ad spend. Include the cost of the solo ad order and any tools used to run the campaign.
- Count new subscribers generated. Divide total spend by subscriber count to get your CPS.
- Track front-end sales. Record revenue from your immediate offer or bridge page during the campaign window.
- Track back-end revenue for 30 days. Log all sales generated from your follow-up email sequence to those new subscribers.
- Calculate total ROI. Use this formula: ROI = ((Total Revenue minus Total Spend) / Total Spend) x 100.
Here is a real-numbers example using 2026 benchmark data. You spend $500 on a 500-click order at $1.00 per click. Your squeeze page converts at 40%, giving you 200 new subscribers and a CPS of $2.50. Front-end sales generate $120 in the first 48 hours. Over 30 days, your email sequence generates an additional $530. Total revenue is $650 against $500 in spend.
"Campaigns initially showing a front-end loss can return 130%+ ROI over 30 days with proper list-building and follow-up."
That 30% ROI looks modest, but you also built a list of 200 engaged subscribers who will continue generating revenue in future campaigns. That is the asset-building model that makes solo ads profitable over time.
When your CPS climbs above $4.00 or your opt-in rate drops below 25%, investigate immediately. The two most common causes are a squeeze page that does not match the traffic's expectations and a vendor sending low-quality or recycled clicks. Soloadsguide covers the most frequent mistakes in detail, including why beginners lose money on solo ads before they understand these patterns.
Best practices to improve your solo ads performance outcomes
Understanding solo ads benchmarks is only half the work. Improving them requires deliberate changes to your funnel, your vendor relationships, and your testing process.
-
Run micro-tests before scaling. Perform 100-click micro-tests before committing to large orders. This confirms traffic quality and establishes your opt-in baseline. Scaling without testing wastes budget if either the funnel or the traffic underperforms.
-
Build purpose-built squeeze pages. Generic landing pages kill opt-in rates. Quality funnels built for solo ads achieve 35–50% opt-in rates on Tier-1 traffic. A focused headline, a single lead magnet, and no navigation links are the three non-negotiable elements. You can find a detailed breakdown in this solo ad traffic funnel guide.
-
Track email open and click-through rates. Clicks and opt-ins are entry-level metrics. Email open rates and click-through rates tell you whether your new subscribers are actually engaged. A list with 500 subscribers and a 3% open rate is worth far less than a list of 200 subscribers with a 25% open rate.
-
Build vendor relationships instead of hopping. Avoiding vendor-hopping and building long-term relationships with proven vendors improves campaign consistency and ROI. Vendors who know your niche and funnel can match you with their most responsive segments. That consistency shows up directly in your opt-in and CPS numbers.
-
Prioritize vendors with proven track records. Vendors with 10+ years of experience and strong positive reviews charge premium prices but deliver better conversion rates. The premium is usually worth it when measured against CPS rather than CPC.
Pro Tip: Test one variable at a time when optimizing. Change your headline, then measure. Change your lead magnet, then measure. Changing multiple elements at once makes it impossible to know what moved the needle.
Key takeaways
Solo ads profitability depends on tracking CPS and 30-day ROI, not just CPC and front-end sales.
| Point | Details |
|---|---|
| CPS beats CPC as a benchmark | Target under $2.00 per subscriber; CPS above $4.00 signals a funnel or traffic problem. |
| Opt-in rate defines traffic quality | Healthy campaigns hit 30–50% opt-in; rates below 25% require immediate investigation. |
| ROI requires 30-day tracking | Front-end sales alone understate returns; back-end email sequences drive the majority of profit. |
| Traffic tier changes all metrics | Premium Tier-1 traffic costs more per click but delivers lower CPS and higher email engagement. |
| Micro-tests prevent wasted spend | Run 100-click tests before scaling to validate traffic quality and funnel performance. |
Why most marketers misread their solo ads numbers
After watching hundreds of affiliate marketers evaluate solo ad campaigns, the pattern is consistent. Marketers look at front-end sales, see a loss, and write off solo ads entirely. They are measuring the wrong thing at the wrong time.
Solo ads are a list-building channel first. The front-end offer exists to offset cost, not to generate profit. The real return comes from the relationship you build with your new subscribers over weeks and months. A campaign that loses $80 on day one but generates $400 over 30 days is not a failure. It is a 400% return on a $100 net investment, plus a growing asset.
The benchmarks covered here are not arbitrary targets. They reflect what consistently profitable campaigns look like across thousands of orders. When your numbers fall outside these ranges, the benchmarks tell you exactly where to look. Low opt-in rate points to your squeeze page. High CPS with good opt-in points to traffic quality. Low email open rates point to list engagement, which usually traces back to traffic tier.
Scaling decisions should never be based on a single campaign. Build a baseline from three to five micro-tests with the same vendor, then scale when your CPS and opt-in rate are consistently within benchmark. Rushing that process is the most expensive mistake you can make in solo ads. The marketers who treat benchmarks as a decision framework rather than a report card are the ones who scale profitably.
— Phil
Start your campaigns with vetted solo ad providers
Knowing the benchmarks is the foundation. Finding vendors who actually hit them is the harder part.
Soloadsguide has done the vetting work for you. The platform features verified Tier-1 traffic sources tested specifically for affiliate marketing funnels, with documented opt-in rates and CPS data from real campaigns. Users have reported up to a 40% reduction in cost per lead after switching to recommended vendors. Whether you are running your first 100-click test or scaling a proven funnel, start at The Solo Ads Guide for a full breakdown of trusted providers. You can also browse the best solo ads providers list, ranked and reviewed for 2026 performance.
FAQ
What is a good opt-in rate for solo ads?
A healthy opt-in rate for solo ads is 30–50%. Rates below 25% typically indicate a funnel issue or low-quality traffic that needs immediate attention.
What is the ideal cost per subscriber for solo ads?
The target CPS for profitable solo ads campaigns is under $2.00. A CPS above $4.00 signals that your funnel or traffic source needs review before you spend more.
How do i calculate solo ads ROI correctly?
Track all revenue generated from new subscribers over 30 days, including back-end email sequence sales, then use the formula: ROI = ((Total Revenue minus Total Spend) / Total Spend) x 100. Front-end sales alone do not reflect true ROI.
Why does cheaper traffic sometimes cost more per subscriber?
Lower CPC traffic with poor opt-in rates produces a higher CPS than premium traffic with strong opt-in rates. For example, $0.30 clicks at 12% opt-in cost more per subscriber than $0.85 clicks at 42% opt-in.
How many clicks should i test before scaling a solo ad campaign?
Run a 100-click micro-test first to validate traffic quality and confirm your opt-in rate falls within the 30–50% benchmark. Scaling before testing leads to wasted spend if either the traffic or funnel underperforms.
Recommended
- Solo Ads vs Facebook vs Google Ads: Which Wins in 2026?
- Solo Ads vs Native Ads: Which Drives Better Results in 2026?
- Placeholder post: solo-ad-cost-per-lead-optimization-that-works | SoloAdsGuide.com
- Solo Ads Budget Allocation: A Practical Guide for Affiliates
Want Verified Traffic Without the Guesswork?
PulseTraffic screens every seller, filters bot clicks in real time, and shows you verified buyer traffic labels before you spend a dollar.